We are surrounded by metrics and statistics. The reason for this is because it is only through tangible measurement of the right things, that we can then make informed, intellectually backed decisions and conclusions. Metrics as a result also act as a feedback loop and an indicator of the health of whatever the subject at hand is, that is being measured.
A simple example of what I’m talking about, applied to the real world, is toilet paper. Bear with me for a second…
How do you know when it is time to take a trip to the supermarket, to buy more toilet paper? Well, the answer is that you most likely have a measurement around it, regardless of whether you realise it or not, that metric answers the question for you. Most people don’t wait for the toilet paper to run out first to act, because by that time, it’s too late. A metric in this case can allow you to determine whether you need more toilet paper and therefore simultaneously also helps you detect and prevent a deterrent situation from occurring early on. Therefore, metrics can also be used as a health check.
Most people probably tend to maintain a mental threshold (possibly the number of unopened toilet paper rolls still unopened still available at home) as the metric which they use to determine whether they need to take a trip to the supermarket, to buy more toilet paper. Whatever this may be for you, your goal is to ensure that you always have sufficient toilet paper available at hand and therefore by tracking the number of rolls of toilet paper you still have available, you determine whether you need to buy more. Simple, right?
By tracking that metric, you are not just using it as a feedback loop or indicator to buy more toilet paper, but also as a way to avoid a catastrophic situation occurring – which is obviously being stuck on the toilet, without any means of going about your business properly.
Who? What? Why? Prove it!
Football is hounded, surrounded and flooded with statistics which can all be used as metrics, in different ways. As a fantasy football player, I could talk to you about team metrics and player metrics all day long. Simple examples of a player metric could be shots in the box. A higher number of average shots in the box for a striker, signals stories such as that the striker is getting into the correct positions for his role as well as being fed chances by his accompanied midfielders in the right manner. Tactically, this is incredibly useful information and why we are seeing football clubs become increasingly more obsessed with statistics and data analysis.
If we expand slightly from merely tracking a player’s average shots in the box, by tracking this metric on a match to match basis and monitoring its fluctuation, it then becomes possible to identify when it potentially regresses. By identifying regression early, it acts as a trigger for the investigation of why that regression occurred. Did the opposition team man mark the striker on this occasion? If so, how can we then use this information we now have to prevent it occurring again? Did the opposition team play with five at the back allowing a centre back double up on the lone striker? If so, then again, how can we then use this information to prevent it occurring again?
You are a billionaire and you own a football club. Your employed manager – Bob – walks into your office and demands an investment of £50,000,000 with the goal of purchasing a brand-new centre back. You ask why. But why do you actually, ask why?
Bob may have a multitude of reasons. These could even be something as simple as a low number of natural players in that position, number of goals conceded, lowest number of successful aerial duels won in the league. Metrics do not have to be rocket science and thus if one is to make a claim or statement, it has to be backed up with some sort of sufficient tangible evidence if they are to expect any sort of credibility in return.
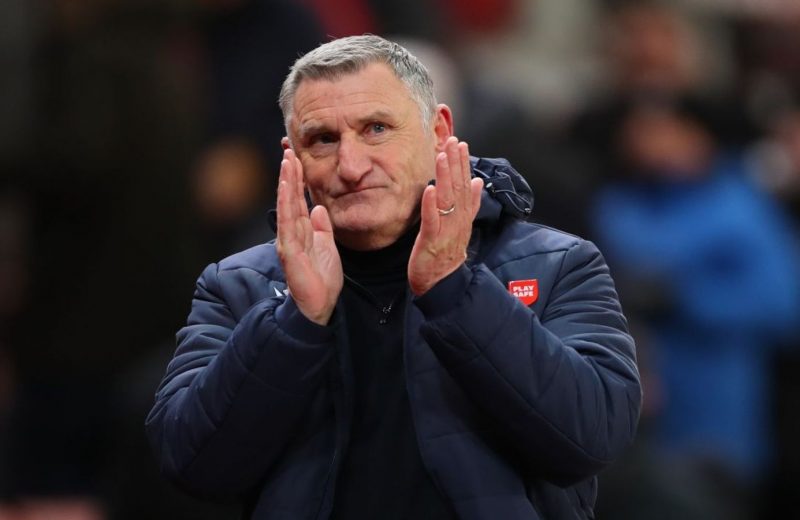
The why in case of this article which we are going to search for should lead to the answer of a question that is currently floating amass in the heads of hundreds and thousands of Blackburn Rovers fans – have Rovers improved this season and if not, should Tony Mowbray’s time as Blackburn Rovers manager come to an end… and if so why? Where’s the palpable proof of that regression?

Tony Mowbray’s Blackburn Rovers for this season are our toilet paper. It’s all well and good that some fans want the manager in, whilst others want him out and others would rather prefer to just shake him all about, but opinions are just opinions and carry little to no weight without data.
There are many who believe the answer to the question we are looking to answer, is no, however I’ve seen plenty fail to conjure up any form of justification for their stance other than by using claims such as “It’s not Tony’s fault that he has a significantly smaller budget than all the other clubs in the Championship because we recently got promoted from League One” regardless of whether that may or may not be factually correct.
Another popular one that I’ve seen thrown about belongs to the fortune tellers amongst the Blackburn Rovers faithful who seem to be very good at theorising that if Tony Mowbray were to be dismissed, he would be replaced by a suited up 12-year-old in the Jack Walker family end and thus we should never change manager again… ever.
Whilst I’d put nothing past the shambolic Venky’s, I prefer a more metricised, logical approach. If you want to make a point – even if it is that Tony Mowbray wears blue and white striped underpants for good luck on a matchday – you need to be able to justify your claim with adequate concrete evidence otherwise you are wasting both your time, and mine.
The contents of this article I hope will live here as a platform for Blackburn Rovers fans to reflect on and use as a baseline for discussion to help generate better, higher quality discussion amongst fans. The statistics we look at should be the basis of our toilet paper’s health check. Is our health check suggesting regression and something to worry about? Or is our health check suggesting that our on the pitch performances have on the contrary, been very unlucky and that in comparison to competition within the division, we are at a disadvantage financially?
I type this the day after Rovers threw away a 2-0 lead at Deepdale – yes, I was painfully there – to add some context of when this was written, should you happen to come past it later in the season.
By the end of this article, it should be clear whether Blackburn Rovers have potentially regressed under Tony Mowbray both on and off the field so far this season. Have Blackburn Rovers really spent significantly less money than everyone else in the Championship and has Tony Mowbray been starved financially relative to most other Championship teams, as some claim? If not, how effective have our moves made in the transfer market been relative to our competition?
Let’s let our metrics and data tell us a story, so that we can find out.
Raw transfer fee spend & wage budgets
The average transfer expenditure per club this season in the Championship is estimated to be around £6million according to Transfermarkt. Again, it isn’t relevant to us how other clubs got this money to spend, or whether they made profit even after spending it, or whether it came about through owner investment or through selling players. All we care about is how our raw spending sits relative to clubs in a similar situation and of a similar stature to us.
Every season in the Championship, we also see a wide variety of wage expenditures reported. In 2018, the average wage bill of a Championship club was £34million per year. In contrast, Rovers’ League One wage bill was reported to be half of that at around £17million once Tony Mowbray finally cleared out the likes of Jason Lowe who were still on inflated contracts from the days of the Premier League. Regardless, it should be mentioned that this was still higher than the wage bills of Barnsley, Brentford, Burton, Millwall, Preston & Sheffield United – all of whom were still competing a division above, in the Championship.
Assuming the average wage growth per year for Championship clubs in the position to grow (e.g. ones who have not just been relegated from the Premier League or are outliers coming up from League One or are suffering from a financial fair play sanction) is roughly 8%, then it wouldn’t be unrealistic to assume the Blackburn Rovers wage bill including transfers and promotion contract clauses increased to roughly £18million (£345k per week) in 2018/19 with a rough increase to the £20million (£381k per week) mark this season in 2019/20 given the players we have signed. These numbers are not exact, but I think are a realistic estimate given the players that we have signed.
It is important to also consider that a team’s movements in the transfer market are always a concoction of not just paying raw transfer fees and the wages that come with the transferred player, but also wages on free agents too. So, a general rule of thumb we’re going to take going forwards in this article, is that we are going to mainly compare Blackburn Rovers only to teams in the same division that are spending similar levels of investment on player recruitment and that we are going to focus purely on what we know as close to factually correct as possible, which is amount spent on raw transfer fees as we do not know accurate numbers for player wages.
If we assume that each of the similar stature teams probably signed an average of 3 free agents and are paying 2 of them a respectable Championship salary of £10,000 per week, with the other being a cheaper, younger player, then that comes to roughly £1million added expenditure for each of these teams per year. For ourselves, let’s assume that in our case, if we are probably slightly above that mark paying the wages of Johnson, Holtby & Downing, since Wigan are covering Mulgrew’s wages, £1million is still a fair rough average estimate. It could be more, it could be less however across all similar Championship sides, it’ll do for now.

Being focused less on the details that we don’t know and being more open minded, allows us to negate added wage spend as an added overhead in the forthcoming sections and graphs than blindly adding it to all clubs and trying to second guess who has spent what on wages through free transfers and contract extensions.
Therefore, whilst it is probably safe to say that as a club, we are probably spending less on wages per annum than a lot of other clubs in the division, it is not down to a lack of investment as we are opting to spend the investment on transfer fees instead.
It is also incredibly rare that clubs will spend very little transfer spend but pay extravagant wage fees to free agents in this division, so our assumptions still stand. We’ll focus on raw transfer spend going forward and whilst we aren’t able to be as exact and accurate as we would like, we will still have enough relative information to roughly estimate and compare Blackburn Rovers to their competitors within the division to answer our hypothesis.
Points per match: Gary Bowyer was sacked
Firstly, context is incredibly important when comparing raw numbers because of obvious differences such as players at the disposal of certain managers, wage budgets and small sample sizes for the current season.
For example, later in this section we’ll look at points per match with context of Blackburn Rovers’ raw club transfer spend that season. However, we must keep in mind that whilst transfer spend may be low in some of those seasons, that may have been due to a balancing act with player wages such as Jordan Rhodes & other highly paid players still on Premier League salaries and so the graph may not always tell the full story when comparing the Bowyer era, to the Mowbray era. We also do not take in to account free transfer wages. So, look at everything with an open logical mind, but most importantly an intellectual one.
To keep things as simple as possible going forward without distorting the data, we need to view Blackburn Rovers as a business. A manager is employed to maximise points per match as much as possible by converting raw transfer spend as a form of investment, into points. It is these points that will achieve promotion to the Premier League that will lead to higher income within the club and generate a club making money and succeeding, rather than spending and losing it.

As one would expect, there is an unsurprising obvious direct correlation between a team’s average points per match won and their final league table standing (yes, I know that sounds obviously stupid). But, it not only allows us to predict very roughly where we may potentially be on course to finish this season after 14 matches if that average points per match doesn’t significantly improve, but also how that compares to previous season finishes, previous Blackburn Rovers managers and whether or not there is most importantly any early sign of improvement from last season.
It is worth bearing in mind that 14 matches are a very small sample size and that Aston Villa after 14 matches were 16th in the Championship last season. They then sacked Steve Bruce and achieved promotion via the play-offs, so take everything with a pinch of salt in football when it comes to this kind of statistic that relies on unknown future data.
At the start of the season, the bookies had us down at 33-1 to finish 15th this season, which is not far off the 20th we would have finished last season had we maintained the points per match we have achieved so far this season, last season. So, providing we do not see a miraculous Villa-like resurgence in the second half of the season, it looks like we will most likely finish in the bottom half of the table – as the bookies predicted.
Gary Bowyer’s points per match of 1.00 after 16 matches in 2015/16 correlated with a relegation spot, which could be used to justify his sacking as a good decision. Paul Lambert helped average the season out at 1.19 after managing a points per match of 1.33 throughout his reign, finishing 15th prior to resigning at the end of the season.
In 2016/17, the red on the bar is obviously Owen Coyle’s record and Tony Mowbray’s impact is seen translucently in the background. Again, food for thought just to get the cogs turning and put into reflection how poor our start so far has been this season.
Gary Bowyer was sacked after a poor start to the season in 2015/16 after reaching a points per match of 1.00. If Blackburn Rovers were to lose their next match versus Sheffield Wednesday at Ewood Park, making it 2 points from a possible 21 for Tony Mowbray, that would leave Rovers with 15 matches played and 15 points and an identical points per match return. Will history repeat itself?

Whilst the raw spend on transfer fees was low under Gary Bowyer due to a balancing act with the likes of Jordan Rhodes’ wages & the rest of Bowyer’s band, it is clear that we have in fact, spent significantly on transfer fees under Tony Mowbray in the last two seasons since promotion from League One in 2017/18. This suggests that there has been a healthy budget made available to the manager to be spent either on transfer fees or wages if required and to match up with a low points per match return could be considered worrying.
Points per match: A return on transfer investment
We said earlier that we’d view Blackburn Rovers as a business and thus a conveyor belt. Money goes in to be spent by a manager on transfer fees and wages and as a result, we expect a higher average points per match to come out of the other end. This is a simple formula but when everything churns out as expected, it tends to indicate both a successful manager and a successful football club.
It’s worth pointing out that going forward, I am excluding teams who have been relegated from the Premier League and ones who are outliers in terms of their mass financial spend such as someone like Bristol City. This is purely because we should not be comparing ourselves to them for now.

As we can see by looking at how the 2019/20 Championship season has gone so far, teams who have a higher points per match (and thus are significantly higher in the league table) such as Leeds, Preston, Queens Park Rangers & Sheffield Wednesday have actually ironically spent amongst the least money in the transfer market this summer on raw transfer fees.
This suggests that most of their transfers, if any, may have been free transfers and whilst they are still covering player wages, the accumulation of wages will rarely surpass amounts that the club hasn’t already recouped through selling a pre-existing player. For example, whilst Preston signed David Nugent & Patrick Bauer on free transfers, the sale of Callum Robinson still leaves them significantly in profit. As a result, their investment on these wages becomes an incredibly negligible expenditure relative to some other raw transfer fees being paid such as £12million by Reading before even considering wages.
It is also worth taking in to account going forward that all teams have signed players on free transfers and it is obvious who the teams are that have signed players for free on outlier commanding wages which means that even if we were to magically figure out those salary figures, this graph would not end up looking too significantly different.
A good outlier example would be the signing of Wayne Rooney at Derby where it is reported he will earn £90,000 a week whilst most other free transfers will be earning significantly less. We discuss this later when we look at Bradley Johnson, Stewart Downing & Lewis Holtby. For now, we want to focus more on ratios, than details.
Lee Bowyer’s Charlton Athletic look to be an incredibly impressive outfit having sold one of their star players in Dijksteel for roughly £2million to Middlesbrough and spending only £200,000 on raw transfer fees to replace him and strengthen the remainder of their squad.
Playing devil’s advocate, Leeds are a team who have had investment in past seasons (they spent £10m on transfers last season), so one may wish to not only exclude them from our small subset here but also take in to account how much other clubs have also spent on transfer fees last season too.

We now have a similar, more long-term overview, except this time we are considering investment alongside the correlation of current points per match this season to the amount spent on raw transfer fees over those past three transfer windows. Again we of course, leave out the massive outlier spenders like Bristol City, Brentford or Nottingham Forest who alone spent £24million last summer and teams relegated from the Premier League. Luton and Charlton have also been removed.
Unsurprisingly, a lot of the same clubs that spent little money in the summer, also spent little money throughout last season. Preston are not a club who have been recently relegated from the Premier League and blessed with huge parachute payments, nor are Sheffield Wednesday who have been battling with financial fair play regulations.
Swansea may have been relegated a couple of seasons ago, but they sold many of their highly paid players after dropping out of the Premier League and have been operating significantly more conservatively, on par with most other clubs at this level on a similar wage structure due to financial fair play restrictions. The argument that teams that spend less, do so because they already have a very good foundation of players and don’t need to, is therefore invalid. If anything, we tend to see the relegated teams such as Fulham & Stoke who have plenty of millions to burn, spend most of the money to replace outgoing players who do not wish to play in the English second division.
Whilst an argument may also be made that promoted teams such as Rovers and Wigan are obliged to spend bigger than teams such as Leeds or Preston to heal damage done from relegation down to League One, we also see a large turnover of top Championship teams losing star players to Premier League teams and replacing them with significantly cheaper buys whilst maintaining their stature in the division.
A lot of the clubs we look at on the graph, are like Blackburn Rovers in that they have had to dip into the lower leagues to purchase players intelligently or use impressive scouting networks abroad to grab bargains such as Brentford’s Said Benrahma for peanuts. Preston for example, sold Callum Robinson to Sheffield United for a fee of £7m in the summer and purchased Tom Bayliss from League One’s Coventry for £2m. Queens Park Rangers sold Luke Freeman to Sheffield United for a fee of £5m and conservatively have used a small chunk of that fee to cover salaries for on loan players such as Jordan Hugill from West Ham whilst also signing free transfers, on lower wage structures such as Todd Kane from Chelsea and Marc Pugh from Bournemouth. From our perspective, we do not care where other clubs are getting money to spend from, we are focused on money out, points in and as things currently stand, Rovers are still not looking good in terms of our points per match this season versus transfer spend despite it being early in the season in comparison to plenty of the competition.
All this information is resulting in a lot of information overload. However, what it allows us to reflect on and put to bed is the idea that Tony Mowbray has had significantly less money to spend on investment in Blackburn Rovers in comparison to all the other teams in the Championship over the past two seasons.
Seeing clubs who have spent so little over the past three transfer windows such as Preston, QPR and Hull City should raise questions as to why they have had betters starts to the season than us. Whilst it is early in the season, the argument can be backed up that it isn’t completely delusional for fans to be worried. It’s understandable that some Rovers fans feel agitated with the clubs movements in the transfer market when competition are succeeding at signing influential players such as Tom Barkhuizen for free and securing the loans of players such as Nahki Wells and Grady Diangana whilst they instead, fork out millions on unproven talent, instead of sharing the love and instead trying to strengthen the squad as a whole.
The below chart is a variation that takes in to account a team’s average points per match by giving a 75% weighting to their 18/19 points per match and a 25% weighting to their points per match so far this season. Blackburn Rovers look slightly better, but still seem to be outperformed by some other clubs with smaller transfer fee spends and whilst some clubs will have a higher annual salary budget, the argument can be that the larger transfer fee spends bring the comparison in to equality. Dare I say it, it proves that financial fair play in the Championship… is genuinely working (except for recently relegated teams who take advantage of Premier League parachute payments).
Again, it doesn’t seem far-fetched to suggest that Rovers should be performing ever so slightly better, relative to their investment made into the transfer market. Rovers are clearly certainly competing with the competition, to say the least. Yet so far this season still somehow find themselves losing matches to Preston, Queens Park Rangers & Birmingham City with only 14 matches played of the season. Let’s not bother talking about losses to Charlton & Luton who would both be lumped as significant outliers, placed at the bottom of this graph.

Blackburn Rovers have been able to spend large on raw fees in the transfer market unlike under Gary Bowyer is partly thanks to Tony Mowbray balancing the wage structure after relegation to League One and cleaning up after previous regimes, to which he deserves credit. However, as things currently stand, the Venky’s have been throwing pound notes into the conveyer belt that is Tony Mowbray’s Blackburn Rovers and are unfortunately not getting the same points per match return that other clubs over the past three transfer windows, on the other hand, have. This could point to numerous issues that could be the cause of this, one of which could be the manager or another which could possibly be the backroom approach on recruitment/scouting. Come the end of the season, we could also on the other hand find ourselves in the top six but like I said, I believe fans have adequate grounds to be asking questions of whether we are regressing or improving off the pitch.
Conclusively, Tony Mowbray has had an adequate amount of transfer spend at his disposal in comparison to other teams competing in the Championship over the past two seasons and thus, people should stop using this as an argument to defend recent Blackburn Rovers results.
We aren’t spending tens of millions, risking financial fair play rules, but we are competing relative to most other teams of a similar stature, in this division. Our wage bill may potentially slightly lower than average, partly down to relegation to a brief stint in League One, however, not enough to divert from the conclusion we have been able to make because we are making up for it with larger transfer fees.
In Mowbray’s defence, the more we look at the numbers, the more the bookies prediction of a mid-table 15th placed finish seems to make sense. Even though that is both significantly lower than the manager’s goal of 70 points and a non-improvement from last season’s 15th place finish.
Note that I am not advocating in favour of those who want a change in manager. I’m advocating that those who have an opinion, need to be able to justify their arguments adequately and in this case, the numbers speak for themselves that the spending argument in defence of Rovers’ poor start to the league campaign, isn’t a strong one.

I’d also like to leave a graph of the raw transfer fees spent by all clubs who haven’t been relegated or promoted in the past two seasons in the Championship. Out of the big spenders (anyone who has spent over £15m over the past two seasons), only Middlesbrough have had parachute payments to burn on transfers. The other teams for the most part have managed to fund their signings due to selling players on to Premier League clubs such as Chris Mepham to Bournemouth for £12m and Adam Webster to Brighton for £20m and recycle this money to keep their clubs afloat within financial fair play rules whilst also simultaneously reinvesting in their squads. This is also down to these clubs having strong recruitment departments who are spotting young talent, investing in it and selling them on.
Whilst Blackburn Rovers are by no means high up on the raw transfer fee list – nor in my opinion does our spending suggest we should be anywhere near the top 6, as the bookies correctly predicted – other teams have shown that you do not necessarily need to spend big, to climb the table and maximise your points return and it’s understandable why Rovers fans might envy other clubs fortune this early on in the season.
I would place Rovers slightly further up on the chart, hazarding a guess that unlike a lot of other teams, our free agent signings will be on higher than average salaries such as Holtby, Downing & Johnson. If you are also wondering why our spend for the past two seasons is £10m (Gallagher – £5m, Armstrong – £2m & Brereton – £3m) rather than £14m, this is because I’ve assumed that we paid £3m up front for Ben Brereton and that the remaining £4m is in add-on clauses. If you want to believe that we outright paid £7m for Brereton, then that would place us just behind Reading.
Bar Reading, all teams who spent over £15m combined in the past two seasons finished in the top half of the table last season. So, whilst the argument can be made that we potentially have not spent enough to compete with teams who finished in the top half last season, it can also be argued that we have depending on the Brereton fee. Suddenly it becomes clear why a set of supporters feel disgruntled at the return of Tony Mowbray’s spending relative to the rest of the market.
Regardless, most importantly however, we still see proof that Blackburn Rovers are indeed competing in terms of transfer spend within the division and are not a poor outlier Oliver Twist outfit of a club, going to India every international break and asking, “please Balaji, can I have some more?” as many fans try to make out in defence of the manager.
On the pitch: A new style of play
If transfer investment is to correlate with a higher points per match and thus a higher league position, this requires teams to obviously win… you guessed it, more points out on the football pitch.
The overall picture is clear from the points per match comparison we saw earlier. Rovers are currently achieving 0.15 less points per match this season, comparing the small sample size of 14 matches, to what they achieved at the end of last season of 1.30. If Rovers were to continue this trend for the remaining 32 matches of the season, then it suggests they would finish with roughly 5 less points come the end of the season.
One thing I mentioned earlier was the concept of expected statistics such as expected goals. Again, I’m a fantasy football player which means that I use Opta statistics to sometimes compare players which helps me decide whether to transfer them in or not.
The reason I mention this is because sometimes in football, a team can go through a poor phase of form and as a fantasy football manager, you need to be able to identify whether certain players or teams are genuinely regressing and playing poorly or have been outright, unlucky.
For example, when teams are going through a poor run of form, their underlying statistics tend to still look relatively close to their regular standard deviation which proves that they are still playing well, they’ve just been unlucky or as the old saying says, they aren’t getting the rub of the green.
For a striker, this would mean that they are clearly still getting a decent number of touches in the box, shots on target and so on despite having not scored in a match or two. This describes a scenario where you would most likely opt to hold on to that player because the evidence is there that they have been unlucky, rather than themselves or their team regressing in their performances.
What I want to try and evaluate is whether Blackburn Rovers are genuinely just going through an unlucky run of form but are still playing better than last season as the manager and some fans keeps suggesting. Which would indicate that over time, these improved performances will eventually inevitably come good and convert in to results. Or whether Rovers have regressed on the pitch and deserve their recent points returns relative to their performances.
Ideally, we would hope to see a slight improvement in the statistics given the expected outcome of money spent, in the transfer window due to an improvement in personnel on the pitch but should be fair and maintain that 14 matches is a small sample size including injury concerns.

As we can see, the change of style of play is evident in the team’s underlying statistics with our average passing success percentage increasing by almost 6% to 75.7%. One would expect this to hopefully improve further as the team gels and plays more matches. Our average possession percentage has also increased by 2.4% and again, one would expect this trend to hopefully continue.
Unfortunately, the less direct approach whilst resulting in 0.4 more average shots per match, we are now also averaging 0.8 less shots on target per match. Whilst the deviation seems very small, our shots on target per game of 3.2 this season in comparison to 4.0 per game last season, would put us 22nd in the league just above the relegated Bolton & Ipswich’s 2.9 and 2.8 if we compare to last season, respectively. This is obviously disappointing considering the largest chunk of the transfer budget was spent on a striker in the summer and a striker last January.
On to the defence – remember, Tony said “defenders are coming” – whilst we are conceding 1.2 less shots per match in comparison to last season’s 13.6 shots per match – likely down to more possession – it still means we concede more shots than we have shots on goal ourselves. Leeds top this statistic with only 9.4 shots conceded per match which highlights the difference between our defence and a real top team’s defence in this league. Unfortunately, everything else defensively also suggests a slight regression or at least a lack of improvement. We are averaging 1.4 less tackles per match, exactly 1 less interception per match and we have thus far, conceded 2 more goals at this stage of the season than the last.
So, are we genuinely going through a poor run of form and still playing well (whatever well means)? The statistics – injuries aside – suggest we have improved slightly in some areas and worsened in others and that once it all cumulates together, despite the change of style of play, our improvements in some areas bring us down to earth with regressions elsewhere and one could argue that the current league table, shows that anyways. We aren’t really defending any better, nor are we scoring more goals to cancel out the goals being conceded down at the other end… just like last season. Approaching things with an open mind, the data most likely suggests that we’ve probably been slightly unlucky with some results relative to performances on the pitch, but that ultimately, we haven’t really improved across the board at all despite the money spent towards new players. Again, the bookies prediction of another 15th place finish doesn’t seem far too unlikely at this stage.
I’m not psychic, so I won’t sit here and suggest where we will finish come the end of the season according to our on the pitch statistics so far but it does look like this poor run of form, may not actually be a poor run of form defensively at least. We have conceded more, and the underlying defensive statistics are down from last season which suggest that we should be conceding more in comparison to last season, which we have done. You might rightly or wrongly, wish to blame this either on lack of investment in defence or injuries.
Offensively however, we are keeping the ball better and we are shooting more at goal, so we are underperforming unfairly going forwards and this makes sense. Holtby should’ve scored when clean through against Huddersfield, being an example chance, which really should’ve made the net bulge. We’ve also hit the woodwork a couple of times this season too.
In conclusion, by analysing our performance data, we’ve managed to deduce to a degree that we haven’t been unlucky defensively but have been unlucky going forwards which is disappointing.
It is important however not to deviate from the underlying hypothesis we are trying to evaluate which is, whether we have thus far seen sufficient evidence to suggest that investment in new talent in the transfer market has helped dramatically improve the squad and so far, the answer is no, not really. Early signs suggest that going forward we will probably score slightly more goals than last season, but that our defence hasn’t improved sufficiently at all even with the absence of Mulgrew and the inclusion of Cunningham for a short stint.
The old saying says that the league table doesn’t lie… and funnily enough, despite all the nit-picking and levels of detail we’ve gone through to reach this point in this article… we’ve reached the same conclusion as the league table. That we are on course to performing worse, than we did last season, despite added investment in the squad.
Conclusion
Transfer investment does not always correlate with a higher point return. We have seen this throughout history, and we will continue to see it, with the likes of Leicester City winning the Premier League over the riches of Manchester City, teams such as Norwich City and Sheffield United achieving automatic promotion to the Premier League last season on small budgets. Charlton so far this season in the Championship after promotion from League One and the likes of Stoke finishing below Rovers in 16th last season after spending millions to bounce back up, to name a few.
More than often, when this occurs, it is the manager who pays for it with his job and so we must question why that does end up being the case in football and whether some fans may have a point when they suggest that after just under three years, it may be time for a change at the Ewood Park helm. Particularly when managers like Chris Wilder, Alex Neil and Neil Warnock seem to be capable of turning rags to riches and turning average players in to league leading performers.
Tony Mowbray deserves credit for fixing the wage structure at Blackburn Rovers. The Venkys whether you like them or not, have supported their manager with an open cheque book within financial fair play limits. But as things currently stand, that spending so far is not correlating with an increased and improvement of points per match or underlying performance statistics with Blackburn Rovers currently sat closer to facing the drop back to League One than standing a chance at breaking in to the top six. With matches coming up against both Leeds & Sheffield Wednesday prior to the next international break, I think all Blackburn Rovers fans need to start looking at the situation objectively. Do not suffer from Stockholm Syndrome because of a 2nd place promotion from League One, with the same squad that finished 15th in the Championship last season.
Have we seen enough evidence to suggest there has been any improvement so far this season? Have the improvements we have seen on the pitch been negated through regression in different areas? Have we seen enough evidence to suggest the same defensive frailties of the past have been fixed? Have we had any major successes yet in the transfer market despite spending roughly £10million? Particularly with questions now being asked of even the likes of Christian Walton who while is a player we do not own, is not on insignificant wages on loan from a Premier League club with an expectation to perform.
Will we do an Aston Villa and see each other at Wembley in 2020? I don’t know, but the data speaks volumes and as things currently stand, answers those questions. Whilst statistics such as 2 points out of 18 or 32 points from 31 games that get passed around on Twitter whilst we are rooted bottom of the Championship form table too tell a story of their own.
Going back to the toilet paper analogy, the metrics that we have analysed throughout the course of this article, with the purpose of giving us an overview of whether or not Blackburn Rovers have indeed regressed both on and off the pitch, are currently suggesting that regression has taken place and that our dealings so far in the transfer market have been poor relative to other clubs in the division. The health check has failed and the warning horns are already being blown around Ewood Park.
Be objective, pay attention to what the statistics are suggesting, pay attention to the league table and finally and as for Tony Mowbray, well… as long as he is manager, in Mowbray we must trust. Let’s hope he turns it around with six points against Leeds & Sheffield Wednesday.
But stop saying we don’t have a competitive budget in comparison to all of the other teams in this division, stop saying we can’t afford to be as active in the transfer market as all of the other teams in this division (particularly as Tony Mowbray has restructured our wage bill), stop saying fans are fickle for questioning why other clubs with smaller transfer budgets or wage pots are higher than us in the table, stop saying we can’t improve on the pitch or that fans are wrong to demand more for their money and should just be grateful to not be in League One anymore, because by skill and hard work – Arte et Labore – anything is possible.
Before I finish off, I want to say that regardless of what occurs in the next couple of weeks with our club, Tony Mowbray still deserves the upmost respect for the job he did at the club during an incredibly tough time and the memory of the League One campaign is one that will probably stick with most of us for our whole lives. So, I urge all fans to treat the man with the respect that he deserves and to back both him and the team during these tough times.
And of course, if you happen to disagree with any of the conclusions made, feel free to let me know on twitter: @KYAN1TE
Thanks for reading.
Sources
http://financialfootballnews.com/championship-2018-finances-wages/
http://financialfootballnews.com/blackburn-rovers-2018-finances-rovers-in-red/
https://www.whoscored.com/Teams/158/Show/England-Blackburn
Note: Transfermarkt have an undisclosed fee for Brereton, therefore throughout this article I have assumed that we have paid £3million up front for Ben Brereton with £4million in add-ons of clauses that need to be triggered plus sell-on fees.
Disclaimer: Not all data is guaranteed to be 100% accurate and is extracted from Transfermarkt and Whoscored.


